Think of descriptive statistics as a way to tell the story of your data in a few key numbers. Instead of listing all 100 test scores, you might say: "the average is 75 and most scores are within 10 points of that." The mean shows where the center is, the median is the middle value (unaffected by extreme scores), and the mode is the most frequent. The standard deviation measures spread — small means data is tightly packed around the mean, large means it's widely scattered. Use n−1 (sample formula) for a subset of data, and N (population formula) when you have all the data.
Both are equally extreme (1.5 standard deviations from the mean), just on opposite sides of the mean.
Variance Using the Shortcut Formula
For the data 2, 4, 4, 4, 5, 5, 7, 9, find the population variance using $\sigma^2=\overline{x^2}-\bar{x}^2$.
$n=8$, $\sum x=40$, so $\bar{x}=5$.
$\sum x^2=4+16+16+16+25+25+49+81=232$, so $\overline{x^2}=232/8=29$.
$$\sigma^2=29-5^2=29-25=4, \quad \sigma=2$$
Final answer: $\sigma^2=4$, $\sigma=2$.
Outlier Detection via Z-Score
A dataset has mean 100 and standard deviation 15. A value of 148 is observed. Is it a potential outlier?
$$z=\frac{148-100}{15}=3.2$$
A z-score with $|z|>3$ is generally considered a potential outlier. Since $z=3.2>3$, the value 148 is a potential outlier and should be investigated.
🧭 Jump to:
Scroll to zoom
Exam Generator Problems
Additional board-style practice items for this topic.
Question Bank: q661
MSTE - Statistics and Probability / Probability / Engr. Janclyde Espinosa (Clidez)
If a certain soccer game ended 3:2, what is the probability that the side that lost scored first? Assume that all scoring scenarios are equiprobable.
2/5
1/4
3/10
5/12
The final score is 3 goals for the winner and 2 for the loser, so there are 5 scoring sequences with 3 W's and 2 L's. Total equiprobable sequences: $\binom{5}{2}=10$ Sequences where the loser scored first fix the first goal as L; the remaining 4 positions contain 3 W's and 1 L: $\binom{4}{1}=4$ $P=4/10$ $\boxed{2/5}$
Question Bank: q667
MSTE - Statistics and Probability / Probability / Engr. Janclyde Espinosa (Clidez)
The probability of event X happening is 2/5 and the probability of event Y not happening is 2/7.
What is the probability of either X, Y, or X and Y happening?
29/35
33/35
31/35
24/35
Given $P(X)=2/5$ and $P(Y^c)=2/7$, so $P(Y)=5/7$. Interpreting the events as independent: $P(X\cup Y)=P(X)+P(Y)-P(X)P(Y)$ $=\frac{2}{5}+\frac{5}{7}-\frac{2}{5}\cdot\frac{5}{7}$ $\boxed{29/35}$
Question Bank: q684
MSTE - Statistics and Probability / Statistics / Engr. Janclyde Espinosa (Clidez)
From the given data shown:
Determine the standard deviation.
1.35
1.48
2.01
2.91
Solution pending in psadquestions/q684.json.
Question Bank: q691
MSTE - Statistics and Probability / Probability / Engr. Janclyde Espinosa (Clidez)
Lots of 40 components each are called unacceptable if they contain 3 defectives or more.
The procedure for sampling the lot is to select 5 components at random and reject the lot if a defective is found.
What is the probability that exactly 1 defective is found in the sample if there are 3 defectives in the entire lot?
0.3011
0.2382
0.1668
0.1853
Use the hypergeometric probability with 3 defectives and 37 good components in a lot of 40. Exactly one defective in a sample of 5: $P=\frac{\binom{3}{1}\binom{37}{4}}{\binom{40}{5}}$ $\boxed{0.3011}$
Question Bank: q724
MSTE - Statistics and Probability / Statistics / Engr. Janclyde Espinosa (Clidez)
The amount of annual rainfall in a region is normally distributed with:
mean = 50 inches
standard deviation = 4 inches
Find the probability that in a randomly picked year the rainfall exceeds 57 inches.
0.0401
0.0104
0.4010
0.1040
Standardize: $z=\frac{57-50}{4}=1.75$ $P(X>57)=P(Z>1.75)$ From the standard normal table: $P(Z>1.75)=0.0401$ $\boxed{0.0401}$
Question Bank: t16
MSTE - Statistics and Probability / Statistics / Civil Engineering Refresher
For a data set of scores 1, 2, 3, 4, and 5 with frequencies of 14, 15, 14, 17, and 10 respectively, calculate the standard deviation.
MSTE - Statistics and Probability / Probability / Besavilla CE Pre-Board Math & Surveying
The probability that component A will operate satisfactorily for 5 years is 0.80 and that B will operate satisfactorily over that same period of time is 0.75. Find the probability in a 5 year period if both components operate satisfactorily.
0.25
0.60
0.30
0.85
0.52
Assuming the satisfactory operation of the two components is independent, multiply their probabilities. $P(A\cap B)=P(A)P(B)$ $P(A\cap B)=(0.80)(0.75)$ $\boxed{P(A\cap B)=0.60}$
Question Bank: w21
MSTE - Statistics and Probability / Statistics / MSTE May 2019
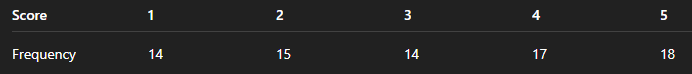
Determine the standard deviation of the given data:
Score
1
2
3
4
5
Frequency
14
15
14
17
10
1.842
1.768
1.162
1.349
With $n = \sum f = 70$: $\bar{x} = \frac{\sum fx}{\sum f} = \frac{204}{70} = 2.914$ Population standard deviation: $\sigma = \sqrt{\frac{\sum fx^2}{\sum f} - \bar{x}^2} = \sqrt{\frac{722}{70} - 2.914^2} = \boxed{1.349}$
Question Bank: w82
MSTE - Statistics and Probability / Statistics / MSTE November 2019
If the standard deviation of a set of observations is 0, you can conclude:
That all observations are the same value.
That there is no relationship between the observations.
That the average value is 0.
That a mistake in arithmetic has been made.
Standard deviation measures the spread of the data about the mean. A standard deviation of 0 means there is no spread, so every value equals the mean — all observations are identical. $\boxed{\text{All observations are the same value.}}$