Influence lines show how internal forces or reactions at a specific location vary as a unit load moves across a structure.
They are particularly useful in determining the critical positions of live loads.
This method is best suited for statically determinate structures. It involves placing a unit load at key points and solving for the response of the desired function (e.g., support reaction, shear, or moment).
Steps:
Select the function you want to analyze: a support reaction, shear at a section, or moment at a section.
Divide the beam into key load positions — usually at supports and points of interest.
Place a unit load (1.0 kN or 1.0 unit) at one position at a time.
Using equilibrium, solve for the value of the function of interest at each load position.
Plot or tabulate the values to create the influence line diagram.
Example Table Format:
Unit Load Position
Support Reaction $R_A$
Shear at Section X
Moment at Section X
At A
1.0
...
...
Midspan
...
...
...
At B
0.0
...
...
The tabular method is exact and useful for numerical influence line diagrams, especially for statically determinate systems.
The Müller-Breslau Principle provides a fast, visual way to sketch the shape of an influence line, even for indeterminate structures.
It states:
“The influence line for a response function (reaction, shear, or moment) has the same shape as the deflected shape of the structure when the corresponding restraint is released and given a unit displacement in the direction of the function.”
Steps:
Identify the function you want to draw an influence line for (e.g., $R_A$, $V_x$, $M_x$).
Modify the structure by releasing the restraint or cut at the location of the function.
Apply a unit displacement in the direction of the desired function:
Vertical displacement for vertical reactions and shear
Rotation for moments
Sketch the deflected shape — this is the qualitative influence line.
Positive displacement direction = positive influence value. The relative height of the sketch indicates the magnitude.
The Müller-Breslau Principle is particularly useful for indeterminate structures or quick checks of influence line shapes.
After using the Müller-Breslau sketch, you can optionally apply the conjugate beam method or unit load method to compute exact ordinates if needed.
-->
🧭 Jump to:
Scroll to zoom
Exam Generator Problems
Additional board-style practice items for this topic.
Question Bank: q5
PSAD - Structural Theory / Influence Line / Engr. Janclyde Espinosa (Clidez)
CE Board May 2010 A simply supported beam 10 meters long has an overhang of 2m at the left support. If a highway uniform load of 9.35kN/m and a concentrated load of 116kN passes through the beam, compute the following based on the influence line for maximum shear at midspan.
Determine the length of the beam where the uniform load could produce maximum positive shear at the midspan.
7m
2m
5m
10m
Determine the length of the beam where the uniform load could produce maximum negative shear at the midspan.
5m
2m
7m
10m
If the concentrated load will be placed at the end of the overhang, compute the maximum shear at the midspan.
23.2kN
58.4kN
30kN
27.9kN
Take a unit load across the beam and draw the influence line for shear at midspan. The overhang is 2 m and the two support-to-midspan regions are each 5 m.
Part 1. The positive portions of the shear influence line are the 2-m overhang and the 5-m region to the right of midspan. Thus the loaded length is $2+5=\boxed{7\text{ m}}$.
Part 2. The negative portion is the 5-m region between the left support and midspan, so the required length is $\boxed{5\text{ m}}$.
Part 3. At the free end of the overhang, the shear influence-line ordinate is $2/10=0.20$. Therefore the 116-kN concentrated load produces
$V_{mid}=116(0.20)=\boxed{23.2\text{ kN}}$.
Question Bank: q138
PSAD - Structural Theory / Influence Line / Engr. Janclyde Espinosa (Clidez)
Refer ot the compound bridge girder shown. Analyze the beam using the influence line diagram. The components of the moving load are the following: Concentrated load = 120kN Uniform live load = 10kN/m
Compute the ordinate at E considering the inluence line of the maximum reaction at F.
1.20
0
1.00
1.50
Calculate the maximum reaction at F in kN.
474
378
447
456
Calculate the maximum reaction at B in kN.
324
307
286
344
### Influence lines for the bridge girder
For a unit load at the internal hinge $E$, isolate the right-hand segment $E$-$G$. The reaction equations are
$\sum M_E=0:\quad 5R_F+30R_G=0,$
$\sum F_y=0:\quad R_F+R_G=1.$
Solving gives the influence-line ordinate
$$R_F=\frac{30}{25}=\boxed{1.20}.$$
The positive part of the influence line for $R_F$ consists of two triangles: one over $DE$ and one over $EG$. Its area is
$$A_+=\frac12(25)(1.20)+\frac12(30)(1.20)=33 \text{m}.$$
Place the concentrated load at the largest positive ordinate, $E$, and cover the positive influence-line area with the uniform load:
$$R_{F,\max}=120(1.20)+10(33)=\boxed{474 \text{kN}}.$$
For reaction $R_B$, the largest positive ordinate is $1.20$ and the positive influence-line area is
$$A_+=\frac12(30)(1.20)=18 \text{m}.$$
Thus
$$R_{B,\max}=120(1.20)+10(18)=\boxed{324 \text{kN}}.$$
The concentrated load is placed at the peak ordinate, while the UDL occupies only the positive portion of the relevant influence line.
Question Bank: q566
PSAD - Structural Theory / Influence Line / Engr. Deguma
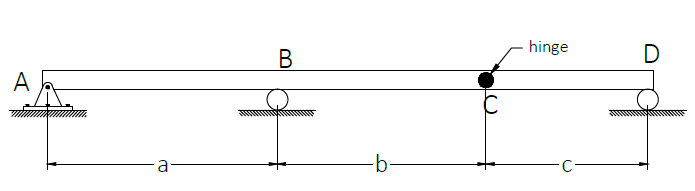
For the beam shown, a=25m, b=5m, and c=15m.
Uniformly Distributed Load, wLL=20kN/m
Concentrated Load = 60kN
For maximum reaction at the support at A, solve for the beam length,
which should be loaded with the uniformly distributed load?
25m
15m
10m
5m
For maximum reaction at the support at D, solve for the beam length,
which should be loaded with the uniformly distributed load?
15m
25m
5m
10m
Which of the following most nearly gives the maximum reaction (kN) at the
support at B due to the given loads?
612
645
588
540
Use the influence line for each support reaction. A uniform live load should cover only the positive portion of the relevant reaction influence line. For reaction at $A$, the positive portion is span $AB=a=25$ m. For reaction at $D$, it is span $CD=c=15$ m.
Place the 60-kN concentrated load at the ordinate producing the largest positive reaction at $B$, and cover the positive $B$-reaction influence-line ordinates with $w=20$ kN/m. Summing the concentrated-load ordinate and the loaded influence-line area gives: $$R_{B,max}=612\text{ kN}$$
Therefore, the UDL lengths are 25 m for maximum $R_A$, 15 m for maximum $R_D$, and the maximum $R_B$ is 612 kN.
Question Bank: q626
PSAD - Structural Theory / Influence Line / Mastermatician
A 12-meter-long beam is simply supported at the right
end and at 2 meters from the left end. It is subjected to a highway
load consisting of 9.35 kN/m uniformly distributed load and 116 kN
concentrated load. Based on the influence line for maximum
moment at midspan,
What is the total length in meters of the beam which should be
subjected to a uniformly distributed load to obtain the
maximum positive moment at midspan?
10
12
2
5
What is the total length in meters of the beam which should be
subjected to the uniformly distributed load to obtain the
maximum negative moment at the midspan?
2
5
10
12
What would be the critical positive moment (kN-m) at midspan
due to the highway lane load?
407
214
325
154
Draw the influence line for moment at the midspan of the beam supported at $x=2$ m and $x=12$ m. The positive ordinates extend over 10 m, while the negative ordinates extend over the 2-m left overhang. Therefore the UDL lengths are 10 m for maximum positive and 2 m for maximum negative moment. Place the 116-kN axle at the peak positive ordinate and cover the positive region with 9.35 kN/m; the critical moment is 407 kN·m.
Question Bank: q628
PSAD - Structural Theory / Influence Line / Mastermatician
A 10 m long beam is simply supported at the left end and at 2
m from the right end. It is to be analyzed for uniformly
distributed moving load. For maximum reaction at the right
support, what is the total beam length (m) which should be
subjected to the moving load?
10m
8m
12m
6m
For reaction at the right support, the reaction influence line is positive over the entire 10-m beam. The moving UDL must cover the whole positive region. Therefore, the loaded length is 10 m.
Question Bank: q629
PSAD - Structural Theory / Influence Line / Mastermatician
The beam in the figure supports a distributed load of
1.5 kN/m and a single concentrated load of 8 kN. The dead load
is 2 kN/m.
Determine the maximum positive moment at C, in kN-m.
13
23
12
18
Determine the maximum positive shear at C, in kN.
6.50
3.45
4.78
4.34
Use the influence lines at section $C$. Place the 8-kN load at the largest positive ordinate and apply the 1.5-kN/m live load over the positive portions; include the 2-kN/m dead load over the full beam. The resulting section actions are 13 kN·m and 6.50 kN.